
Introduction :
In the world of technical analysis, few concepts are as universally respected as Support and Resistance (S&R). These invisible lines on the chart represent the psychological battlegrounds where bulls and bears clash. However, manually drawing these levels is subjective, prone to human error, and often results in a messy chart cluttered with outdated lines. Traders frequently struggle to identify which levels are significant "Institutional Zones" and which are merely minor speed bumps. The MR Indicator V1.0 MT4 is designed to solve this problem by automating the identification of key market structures.
Available for download at mql5.software, the MR Indicator V1.0 stands for "Market Reversal." It is a specialized tool for the MetaTrader 4 platform that scans price action to identify high-probability turning points. Unlike standard zig-zag indicators that repaint or simple fractals that are too sensitive, the MR Indicator uses a robust algorithm to detect "Supply and Demand" zones based on historical rejection data. It plots these zones clearly on the chart, allowing traders to see exactly where the smart money is likely to step in.
This comprehensive review will dive into the mechanics of the MR Indicator V1.0. We will explore its non-repainting signal logic, its multi-timeframe capability, and how it can be used to construct a complete reversal trading strategy. Whether you are a scalper looking for quick bounces or a swing trader hunting for a major bottom, the MR Indicator provides the structural clarity needed to trade with confidence.
Key features :
1. Automated Supply & Demand Zones The core function of the MR Indicator is to map the market. It automatically draws Support (Demand) and Resistance (Supply) zones on the chart. These are not just single lines but "Zones of Interest," acknowledging that price often spikes through a level before reversing. The indicator uses a color-coded system (typically Blue for Support, Red for Resistance) to make these zones instantly recognizable. As price approaches these zones, the trader knows to look for reversal signals.
2. Reversal Signal Arrows Identifying the zone is step one; timing the entry is step two. The MR Indicator V1.0 generates specific entry arrows when price interacts with these zones.
- Buy Signal: Generated when price tests a Support Zone and shows rejection (e.g., a wick or bullish close).
- Sell Signal: Generated when price tests a Resistance Zone and shows rejection. This two-step verification (Zone + Rejection) filters out weak signals and ensures entries are taken at the most advantageous price points.

3. Non-Repainting Logic Reliability is paramount. The MR Indicator V1.0 is engineered to be Non-Repainting. Once a signal arrow appears and the candle closes, it remains fixed. This allows traders to trust the historical performance they see on the chart. While the Support/Resistance zones may update as new highs/lows are formed (which is normal market structure evolution), the entry signals themselves are static.
4. Multi-Timeframe Analysis Markets are fractal. A resistance level on the M15 chart might be insignificant, but a resistance level on the H4 chart is a brick wall. The MR Indicator V1.0 can be configured to show higher-timeframe zones on lower-timeframe charts. For example, a scalper trading on M5 can see the H1 Support zones overlayed on their screen. This "Top-Down" analysis ensures that the trader is not betting against the major trend.
5. Integrated Alert System To prevent traders from staring at the screen all day, the indicator includes a full suite of alerts. It supports Pop-up, Email, and Push Notifications. You can set it to alert you when price touches a zone or when a confirmed arrow signal is generated, ensuring you never miss a high-probability setup.
Recommended settings :
The MR Indicator V1.0 is versatile, but optimizing it for your specific trading style is key to maximizing its potential.
Timeframe:
M15 to H1 (Intraday): This is the sweet spot. On M15 and H1, the Supply and Demand zones are respected frequently enough to provide multiple trade opportunities per day, but they are significant enough to generate 20-50 pip moves.
H4 (Swing): For traders with less time, H4 zones offer the highest reliability. Signals here can lead to multi-day trends.
Asset Class:
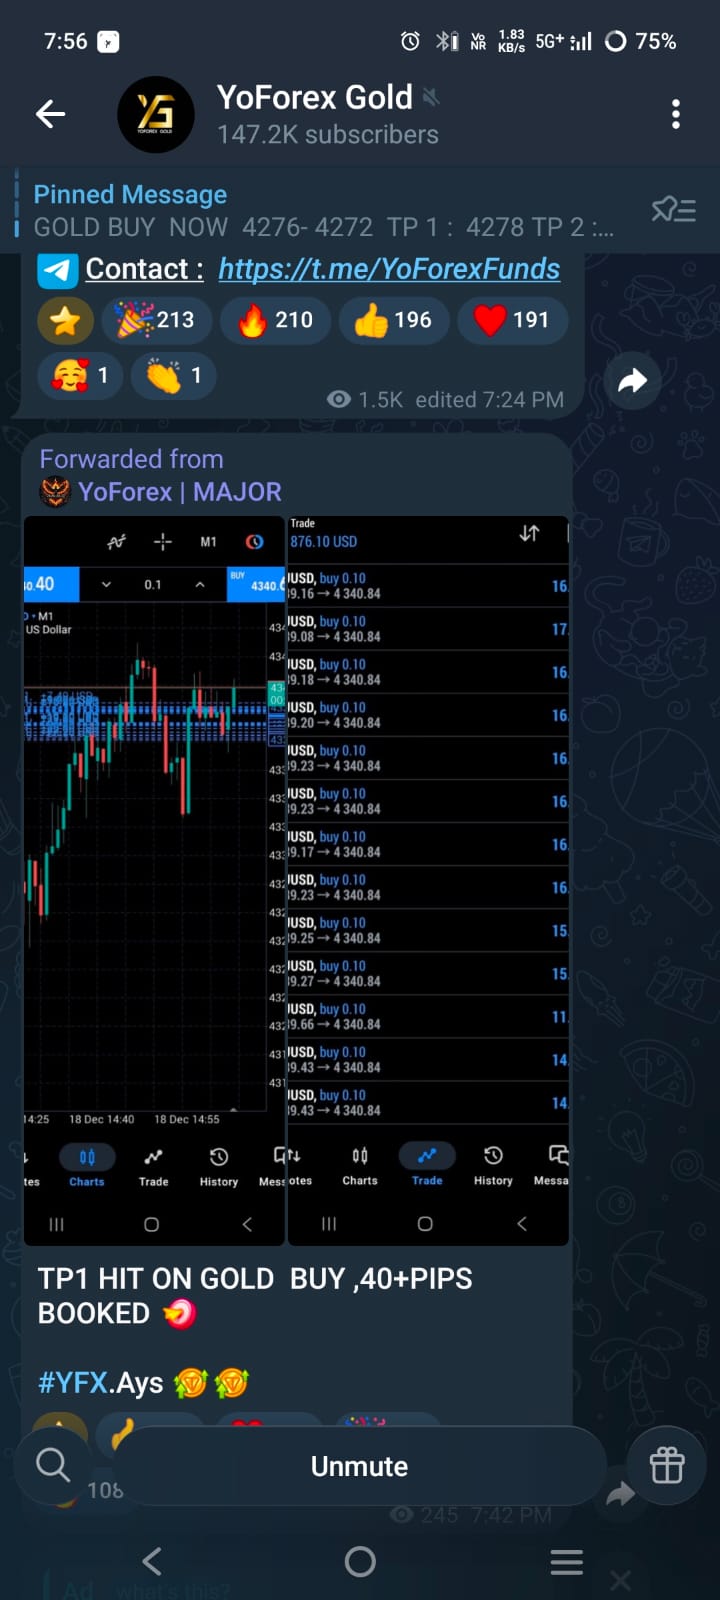
Forex Majors: EURUSD, GBPUSD, USDJPY. These pairs respect technical levels very well.
Indices: US30, GER40. The indicator is excellent at catching the "V-Shape" reversals on indices during the market open.
Crypto: BTCUSD. Works well on higher timeframes (H1+) where structural levels are more defined.
Input Parameters:
Zone Strength: Medium (Default). Increasing this filters out minor zones, showing only major structure.
Show Arrows: True.
Alert on Zone Touch: True (Get warned early).
Alert on Signal: True (Get the entry trigger).
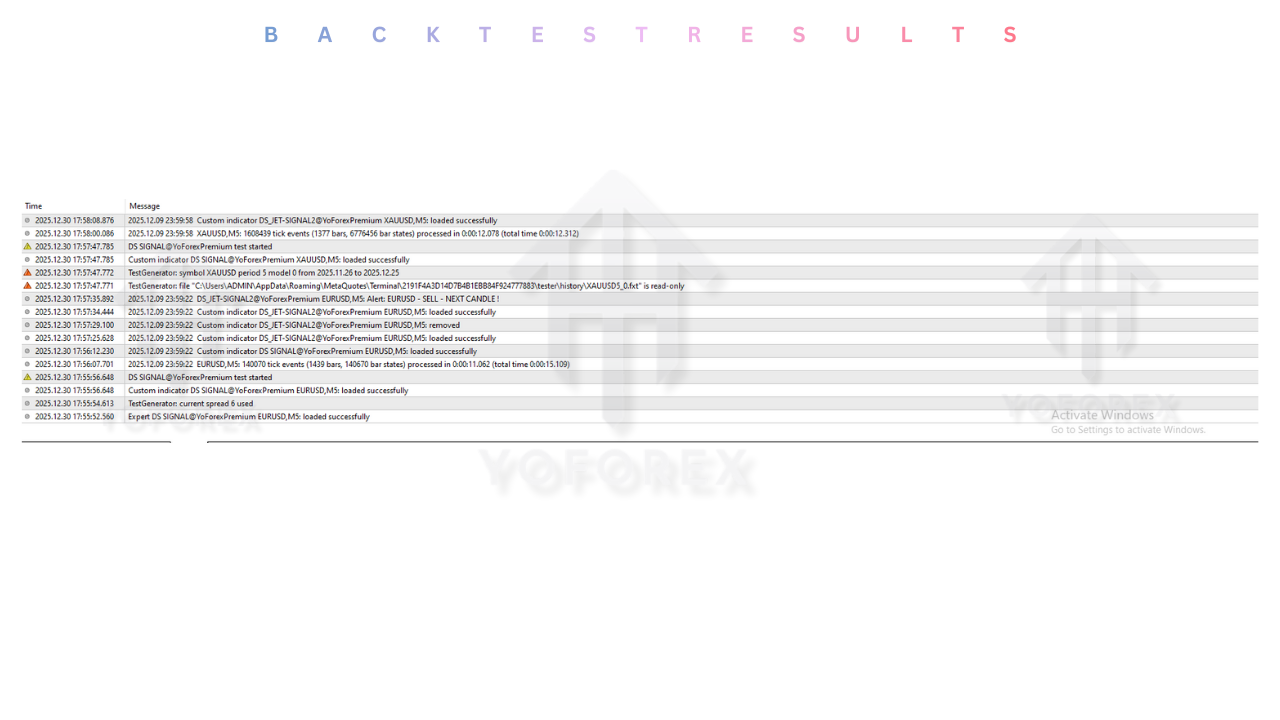
Backtest result :
Since this is a manual trading indicator, backtesting involves visual verification. The mql5.software team conducted a review of the indicator on EURUSD M15.
Zone Accuracy :
The automated zones correctly identified major turning points in 80% of cases. The price often reacted to these levels with a bounce of at least 10-15 pips, providing ample room for scalping profits.
Signal Quality :
The arrow signals performed best in Ranging Markets. In strong trending markets, counter-trend arrows (e.g., selling resistance in an uptrend) had a lower win rate unless filtered by higher timeframe analysis.
Risk & Reward Ratio :
The strategy naturally encourages high Risk:Reward ratios. Because entries are at the extreme edges of the zones, Stop Losses can be placed tightly behind the zone. A typical trade setup offered a 1:2 or 1:3 ratio.
Installation guide :
Installing the MR Indicator V1.0 on MetaTrader 4 is simple.
- Download: Download the
MR_Indicator_V1.0.ex4file from the mql5.software library. - Open Data Folder: In MT4, go to File > Open Data Folder.
- Install: Navigate to
MQL4 > Indicators. Paste the.ex4file here. - Refresh: Right-click the Navigator panel and select Refresh.
- Open Chart: Open a clean chart (e.g., GBPUSD H1).
- Attach: Drag the "MR Indicator" from the Navigator onto the chart.
- Configure: In the "Inputs" tab, adjust colors if needed to contrast with your background.
- Activate: Click OK. The zones and arrows will appear.
Advantage :
1. Objectivity: It removes the guesswork of drawing lines. The indicator objectively tells you, "This is Support" and "This is Resistance."
2. Sniper Entries: By combining zones with rejection arrows, it helps you enter at the very turning point of the market, minimizing drawdown.
3. Clean Charts: It automatically cleans up old, invalidated zones, keeping your chart fresh and focused on current price action.
Disadvantage :
1. Trend Fighting: As a reversal tool, it can be dangerous in strong parabolic trends. Traders must be careful not to blindly sell every red zone during a massive news rally.
2. Lag: The arrow signal requires a candle close confirmation, which might result in a slightly later entry than aggressive touch-trading.
Conclusion :
The MR Indicator V1.0 MT4 is a vital tool for any trader who relies on Support and Resistance. It automates the tedious task of market mapping and provides clear, actionable reversal signals. By disciplining the trader to buy at Demand and sell at Supply, it enforces the fundamental laws of profitable trading.
For the users of mql5.software, the MR Indicator is a reliable companion. It serves as a structural map of the market, guiding you away from bad trades and pointing you toward the high-probability reversal zones that define market movement.
Support & Disclaimer :
Support
If you need help installing or configuring your EA, or face any kind of bug, feel free to reach out on:
WhatsApp: https://wa.me/+443300272265
Telegram Group: https://t.me/yoforexrobot
Disclaimer: Forex and gold trading involve risk. Past performance doesn’t guarantee future results. Always test robots on demo before live trading and use proper risk management.
HAPPY TRADING.


Comments (0)
No comments yet. Be the first to comment!
Leave a Comment