Mastering the Divergence CCI Indicator V1.1 MT4: A Comprehensive Guide for Forex Traders
The Commodity Channel Index (CCI) has long been a staple in the toolkit of technical analysts and forex traders worldwide. Among the various CCI-based indicators available, the Divergence CCI Indicator V1.1 for MetaTrader 4 (MT4) stands out as a specialized tool designed to detect and highlight divergence patterns between price action and the CCI itself. Divergence trading is a powerful methodology that professional traders employ to identify potential trend reversals or continuations before they become evident in the price action alone.
In this comprehensive guide, we'll explore everything you need to know about the Divergence CCI Indicator V1.1 for MT4. From understanding the underlying CCI calculation to implementing advanced trading strategies, this article will equip you with the knowledge to effectively incorporate this indicator into your trading approach.
Understanding the Commodity Channel Index (CCI)
Before diving into the specifics of the Divergence CCI Indicator, it's essential to grasp the fundamentals of the Commodity Channel Index. Developed by Donald Lambert in the 1980s, the CCI was initially created to identify cyclical turns in commodities markets. However, its versatility has led to widespread application across various financial instruments, including forex, stocks, indices, and cryptocurrencies.
The CCI is classified as a momentum oscillator, which means it measures the speed and change of price movements. Unlike many other oscillators, the CCI is unbounded, meaning it doesn't fluctuate within a fixed range. However, most readings typically fall between -100 and +100.
The mathematical formula for the CCI is as follows:
CCI = (Typical Price - SMA of Typical Price) / (0.015 × Mean Deviation)
Where:
- Typical Price = (High + Low + Close) / 3
- SMA of Typical Price = Simple Moving Average of the Typical Price over the specified period
- Mean Deviation = Average of the absolute deviations from the SMA of Typical Price
The default period for the CCI is typically 20, but this can be adjusted based on the trader's preference and the timeframe being analyzed.
Readings above +100 generally indicate overbought conditions, suggesting that the asset may be due for a price correction. Conversely, readings below -100 typically indicate oversold conditions, potentially signaling an upcoming upward price movement. However, the most valuable signals from the CCI often come from divergence patterns, which is precisely where the Divergence CCI Indicator V1.1 excels.
What is Divergence in Trading?
Divergence is a powerful concept in technical analysis that occurs when the price of an asset moves in the opposite direction of an oscillator or indicator. This discrepancy often signals a potential trend reversal or continuation, providing traders with early warning signs that may not be evident from price action alone.
There are four primary types of divergence that traders should be familiar with:
- Bullish Divergence: This occurs when the price makes lower lows, while the indicator makes higher lows. This pattern suggests that downward momentum is weakening and a potential bullish reversal may be imminent.
- Bearish Divergence: This happens when the price makes higher highs, while the indicator makes lower highs. This indicates that upward momentum is waning and a potential bearish reversal could be on the horizon.
- Hidden Bullish Divergence: This pattern emerges when the price makes higher lows, while the indicator also makes higher lows. Hidden bullish divergence suggests that the uptrend is likely to continue.
- Hidden Bearish Divergence: This occurs when the price makes lower highs, while the indicator makes lower highs. Hidden bearish divergence indicates that the downtrend is probably set to persist.
Divergence trading is particularly valuable because it often provides signals before a trend change becomes apparent in the price action alone. However, like all technical analysis tools, divergence signals work best when confirmed by other forms of analysis and proper risk management.
Overview
The Divergence CCI Indicator V1.1 for MT4 is a specialized tool designed to automatically detect and highlight divergence patterns between price action and the CCI. This indicator is particularly valuable for traders who want to capitalize on divergence opportunities without manually scanning charts for these patterns.
Key Features
The Divergence CCI Indicator V1.1 offers several features that make it a powerful addition to any trader's toolkit:
- Automatic Detection: The indicator automatically identifies and marks bullish and bearish divergence patterns on the chart.
- Visual Alerts: Provides clear visual signals when divergence patterns are detected, typically with arrows and labels.
- Customizable Settings: Allows traders to adjust the sensitivity, appearance, and alert parameters of the indicator.
- Multi-Timeframe Compatibility: Works effectively across all timeframes, from the 1-minute chart to the monthly chart.
- Versatility: Applicable to various financial instruments, including forex pairs, commodities, indices, and stocks.
- User-Friendly Interface: Designed with simplicity in mind, making it accessible to traders of all experience levels.
Installation and Setup
Installing the Divergence CCI Indicator V1.1 on your MT4 platform is a straightforward process:
- Download the Indicator File: Obtain the indicator file (typically a .mq4 or .ex4 file) from a reliable source.
- Access the MT4 Data Folder: Open your MT4 platform and navigate to "File" > "Open Data Folder."
- Navigate to the Indicators Folder: In the new window, go to "MQL4" > "Indicators."
- Copy the Indicator File: Place the downloaded indicator file into the "Indicators" folder.
- Restart MT4: Close and reopen your MT4 platform to ensure the indicator is properly loaded.
- Apply the Indicator: Click "Insert" > "Indicators" > "Custom" and select the Divergence CCI Indicator from the list.
- Adjust Settings: Configure the indicator settings according to your preferences (more on this below).
Basic Settings Configuration
The Divergence CCI Indicator V1.1 typically includes several customizable settings:
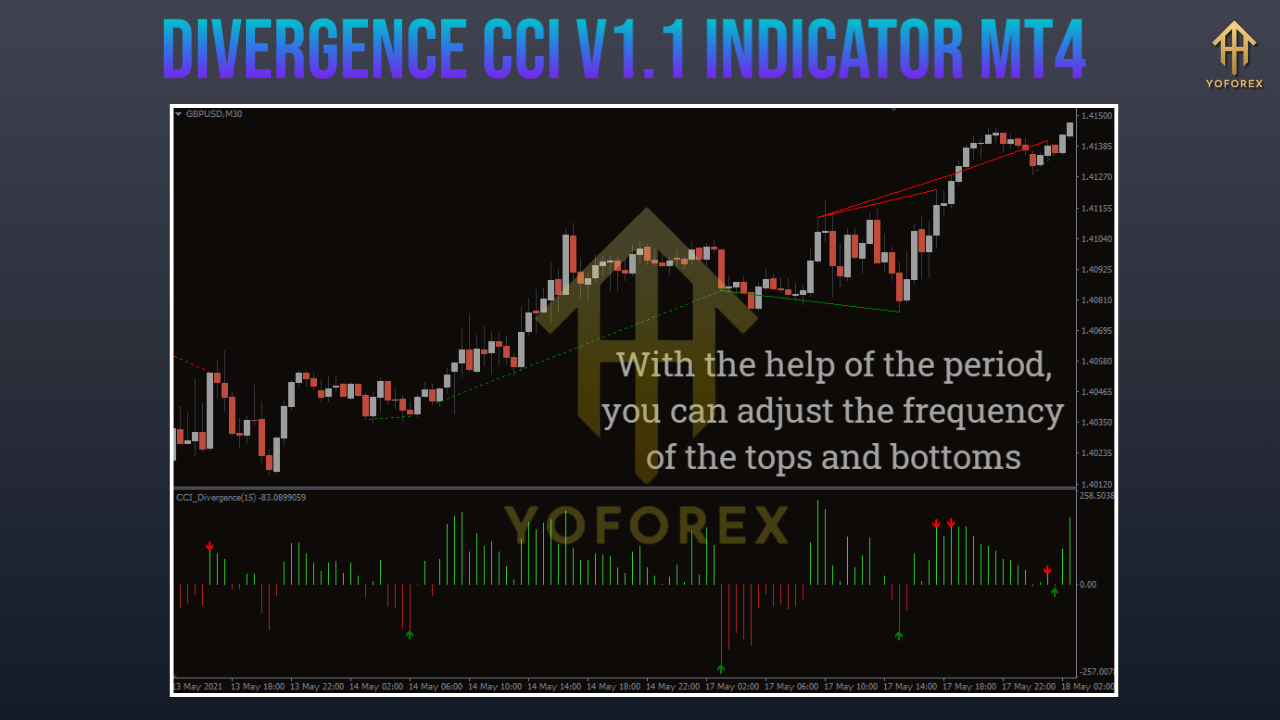
- CCI Period: The number of periods used to calculate the CCI (default is usually 20).
- Alert Settings: Options for enabling price alerts, email notifications, or push notifications when divergence is detected.
- Visual Settings: Customizable colors, line styles, and display options for divergence signals.
- Sensitivity: Adjusts how the indicator detects divergence patterns, with higher sensitivity potentially generating more signals but also more false positives.
Traders should experiment with these settings to find the optimal configuration for their trading style and the timeframe they're analyzing.
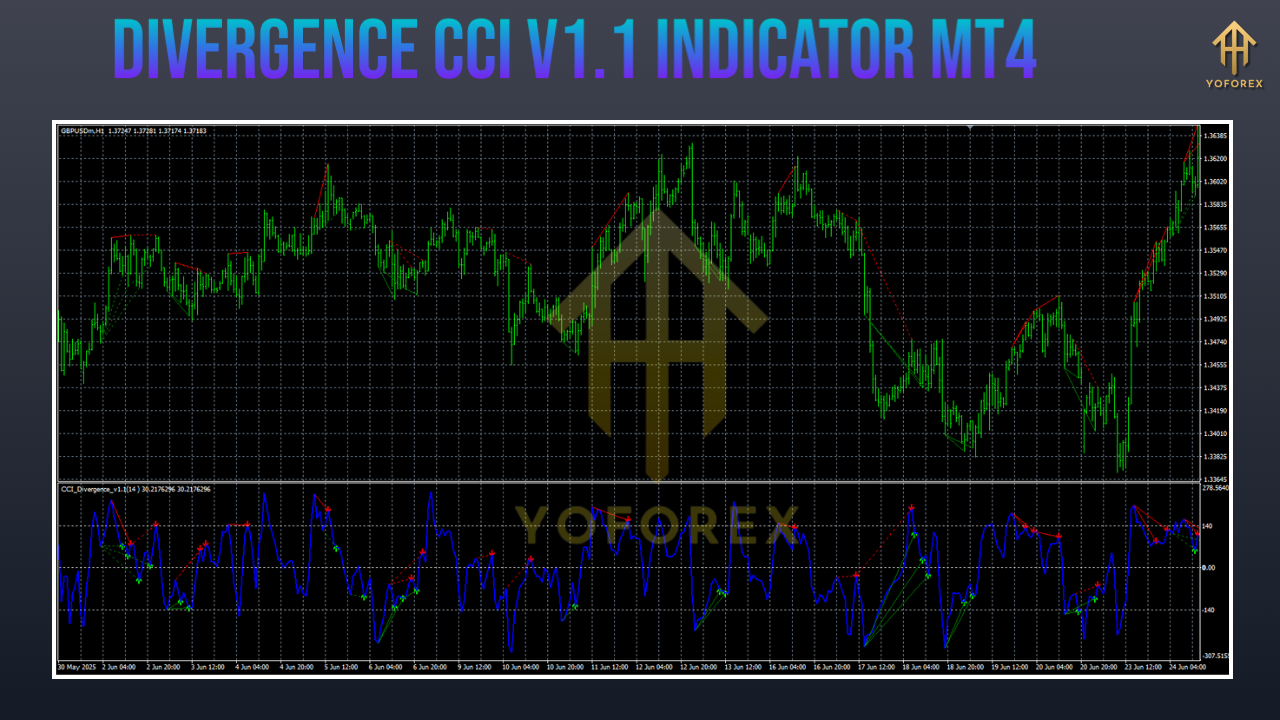
Reading and Interpreting the Indicator Signals
Once installed and configured, the Divergence CCI Indicator V1.1 will display divergence patterns on your chart. Understanding how to interpret these signals is crucial for successful trading.
Bullish Divergence Signals
The indicator will typically mark a bullish divergence with:
- An upward-pointing arrow near the relevant price low
- A "Bullish Divergence" label
- Possibly a horizontal line connecting the price lows and indicator lows
This pattern suggests that downward momentum is weakening and a potential upward price movement may be imminent. Traders might consider this a signal to look for buying opportunities.
Bearish Divergence Signals
Similarly, a bearish divergence will be marked with:
- A downward-pointing arrow near the relevant price high
- A "Bearish Divergence" label
- Possibly a horizontal line connecting the price highs and indicator highs
This indicates that upward momentum is waning and a potential downward price movement could be ahead. Traders might view this as a signal to look for selling opportunities.
Confirmation Signals
The indicator may also provide additional confirmation signals, such as:
- When the CCI crosses above or below key levels (e.g., +100 or -100) in conjunction with a divergence pattern
- Color changes in the CCI line when divergence is detected
- Alert notifications when divergence patterns complete
It's important to note that while divergence signals can be powerful, they work best when confirmed by other technical analysis tools and price action patterns.
Trading Strategies Using the Divergence CCI Indicator
Incorporating the Divergence CCI Indicator into your trading strategy can enhance your ability to identify high-probability trading opportunities. Here are several effective strategies to consider:
1. Divergence with Support and Resistance
This strategy combines divergence signals with key support and resistance levels:
- Step 1: Identify a divergence pattern using the indicator.
- Step 2: Wait for price to approach a significant support or resistance level.
- Step 3: Enter a trade in the direction of the divergence when price reacts at the support/resistance level.
- Step 4: Place a stop-loss beyond the recent swing high/low.
- Step 5: Set profit targets based on previous price levels or a favorable risk-reward ratio.
This approach helps ensure that your trades are aligned with significant price levels, potentially improving the risk-reward profile.
2. Divergence with Moving Average Crossover
This strategy uses a moving average crossover as a trend filter:
- Step 1: Apply moving averages (e.g., 20 EMA and 50 EMA) to your chart.
- Step 2: Use the crossover of these moving averages to determine the overall trend direction.
- Step 3: Look for divergence patterns in the direction of the trend.
- Step 4: Enter a trade when the divergence is confirmed and aligned with the trend.
- Step 5: Use appropriate stop-loss and take-profit levels.
This strategy helps avoid trading against the prevailing trend, which can improve the reliability of divergence signals.
3. Divergence with RSI Confirmation
This dual-indicator approach seeks confirmation from two different oscillators:
- Step 1: Apply the RSI indicator alongside the Divergence CCI Indicator.
- Step 2: Look for simultaneous divergence signals on both indicators.
- Step 3: Enter a trade when both indicators show divergence in the same direction.
- Step 4: Implement proper risk management techniques.
This approach provides additional confirmation, potentially increasing the probability of successful trades.
4. Divergence with Fibonacci Retracement
This strategy combines divergence analysis with Fibonacci levels:
- Step 1: Identify a divergence pattern using the indicator.
- Step 2: Draw Fibonacci retracement levels from the recent swing high to low (or vice versa).
- Step 3: Enter a trade when price retraces to a key Fibonacci level (e.g., 38.2%, 50%, or 61.8%) in conjunction with the divergence.
- Step 4: Set stop-loss and take-profit levels based on Fibonacci extensions and price structure.
This provides a structured approach to determining entry and exit points, adding a layer of objectivity to your trading decisions.
5. Multiple Timeframe Divergence Trading
This strategy analyzes divergence patterns across multiple timeframes:
- Step 1: Analyze divergence patterns on a higher timeframe (e.g., daily chart).
- Step 2: Look for corresponding divergence patterns on a lower timeframe (e.g., 4-hour chart).
- Step 3: Enter a trade when divergences on both timeframes align.
- Step 4: Use the higher timeframe for trend direction and the lower timeframe for entry timing.
This approach provides a more comprehensive view of market momentum and can help filter out false signals that might appear on a single timeframe.
Benefits of Using the Divergence CCI Indicator
The Divergence CCI Indicator V1.1 offers several advantages for traders:
- Early Warning System: Divergence patterns often provide early signals of potential trend changes, allowing traders to enter positions before the majority of the market recognizes the opportunity.
- Objective Signal Generation: The indicator removes the subjectivity of manually identifying divergences, providing clear, objective signals that can be consistently applied.
- Customizable: The indicator's settings can be adjusted to suit different trading styles and timeframes, making it adaptable to various market conditions.
- Versatility: Works across various financial instruments and timeframes, making it suitable for different trading approaches.
- Confirmation of Other Signals: Divergence signals can serve as valuable confirmation for other technical analysis methods, strengthening your overall trading strategy.
Limitations and Considerations
While the Divergence CCI Indicator V1.1 is a powerful tool, it's essential to be aware of its limitations:
- False Signals: Like all indicators, it can produce false signals, especially in ranging markets with no clear trend direction.
- Lagging Nature: As with most technical indicators, there is a slight lag between price action and the signals generated.
- Not a Standalone Tool: Divergence signals work best when combined with other forms of analysis, such as price action, support/resistance, and risk management.
- Market Context: The effectiveness of divergence signals can vary depending on market conditions and volatility.
- Learning Curve: Proper interpretation of divergence patterns requires experience and understanding of market context.
Tips for Effective Usage
To maximize the effectiveness of the Divergence CCI Indicator V1.1, consider the following tips:
- Combine with Other Indicators: Use the indicator in conjunction with other technical analysis tools to confirm signals and filter out false positives.
- Consider Market Context: Divergence signals are more reliable in trending markets than in ranging markets. Always consider the broader market environment.
- Practice on Demo Account: Test the indicator and strategies on a demo account before trading with real money to gain familiarity and confidence.
- Adjust Settings for Different Timeframes: Optimize the indicator settings for different timeframes to improve signal accuracy and reduce false signals.
- Implement Proper Risk Management: Always use stop-loss orders and appropriate position sizing to protect your trading capital.
- Monitor Economic Events: Be aware of upcoming economic announcements that could impact market volatility and indicator reliability.
- Keep a Trading Journal: Record your trades and the performance of the indicator to refine your strategy over time.
- Stay Disciplined: Follow your trading plan consistently and avoid making impulsive decisions based on isolated signals.
Conclusion
The Divergence CCI Indicator V1.1 for MT4 is a valuable tool for traders looking to capitalize on divergence patterns in the market. By automatically detecting and highlighting these patterns, the indicator saves time and helps traders identify high-probability trading opportunities that might otherwise be missed.
However, like all technical indicators, it works best when used as part of a comprehensive trading plan that includes proper risk management and confirmation from other analysis methods. The key to success with the Divergence CCI Indicator lies in understanding its strengths and limitations, testing it thoroughly, and adapting it to your individual trading style.
With practice and patience, this indicator can become a valuable addition to your trading toolkit, helping you navigate the complexities of the financial markets with greater confidence and precision. Remember that no indicator guarantees success, but when used correctly, the Divergence CCI Indicator V1.1 can provide a significant edge in your trading endeavors.
Support & Disclaimer
Got questions or need help? Reach out anytime:
- WhatsApp: https://wa.me/+443300272265
- Telegram: https://t.me/yoforexrobot
Disclaimer: Past performance is no guarantee of future results. All trading carries risk. Always demo-test the Divergence CCI Indicator V1.1 MT4 in a risk-free environment before deploying on a live account.


Comments (0)
No comments yet. Be the first to comment!
Leave a Comment