The FRACTAL MTF Indicator V1.0 for MetaTrader 4 (MT4) is a powerful tool designed to enhance technical analysis for forex traders. By leveraging the multi-timeframe (MTF) capabilities of fractal patterns, this indicator helps identify critical price levels across various currency pairs and timeframes. Whether you're scalping on the M1 chart or analyzing long-term trends on the D1 chart, the FRACTAL MTF Indicator provides actionable insights for traders with a minimum deposit as low as $200. In this blog post, we’ll explore the indicator’s features, its application across currency pairs like EUR/USD, GBP/USD, USD/JPY, AUD/USD, and USD/CAD, and how to use it effectively across multiple timeframes (M1, M5, M15, H1, H4, D1).
Understanding Fractals in Forex Trading
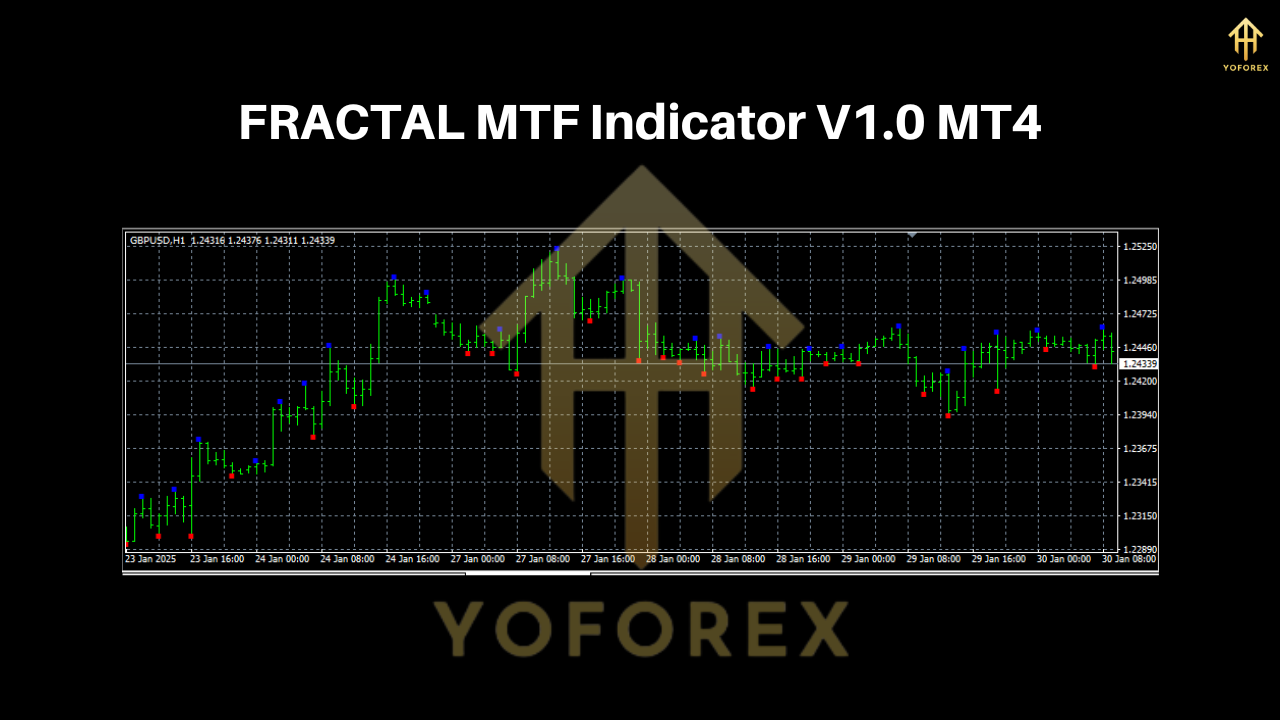
Fractals, introduced by Bill Williams, are a cornerstone of technical analysis, identifying local price extrema that signal potential reversals or continuations. A fractal is typically a five-candle pattern where the middle candle represents a high or low compared to its neighbors. An up-fractal forms when the middle candle’s high is higher than the two candles on either side, indicating a potential resistance level. Conversely, a down-fractal occurs when the middle candle’s low is lower than its neighbors, suggesting a support level.
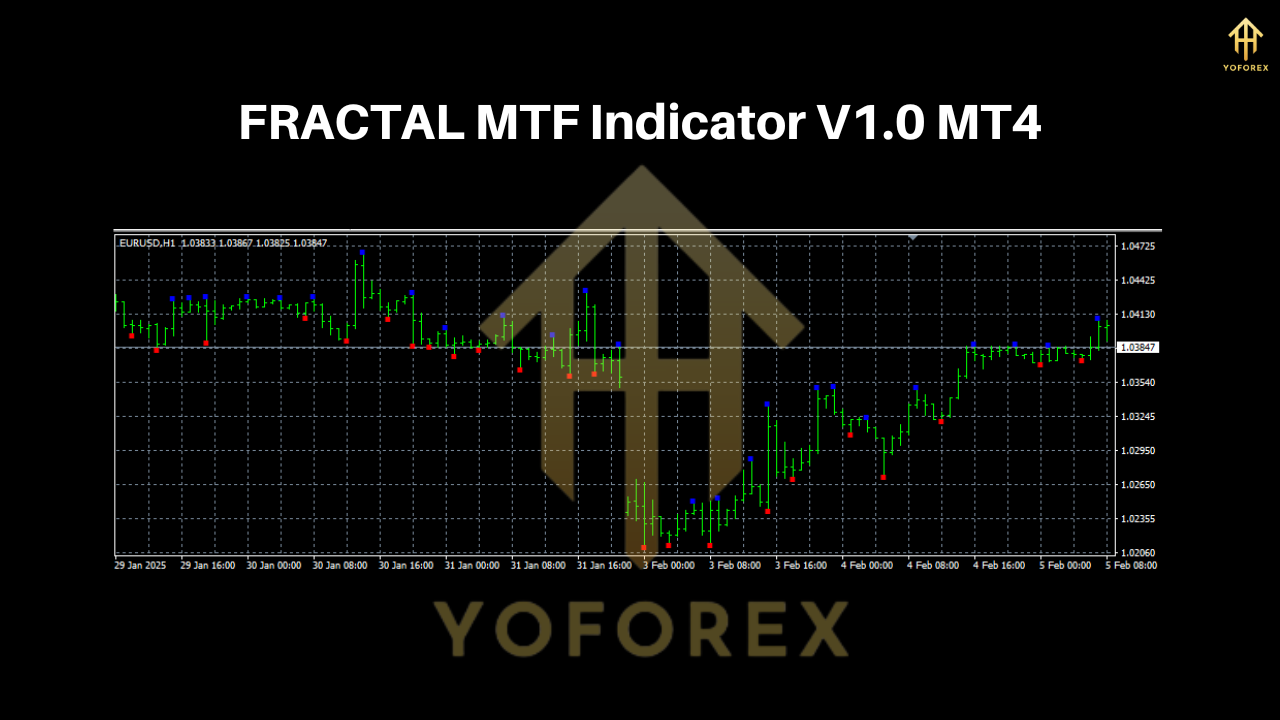
The FRACTAL MTF Indicator builds on this concept by allowing traders to view fractal patterns from higher timeframes on lower timeframe charts. For example, a trader on the M15 chart can see D1 fractals, providing a broader market perspective without switching charts. This multi-timeframe approach enhances decision-making by aligning short-term trades with longer-term trends.
 Key Features of the FRACTAL MTF Indicator V1.0
The FRACTAL MTF Indicator V1.0 offers several features that make it a versatile tool for forex traders:
- Multi-Timeframe Analysis: Traders can select a higher timeframe (e.g., H4 or D1) and view its fractals on a lower timeframe (e.g., M1 or M5). This helps identify significant support and resistance levels that align with the broader market structure.
- Customizable Settings: Users can adjust the neighborhood radius (default is 2, as per Bill Williams’ methodology) to identify fractals of varying degrees. A larger radius captures more significant extrema, while a smaller radius focuses on minor price swings.
- Extend Line Function: The indicator can draw horizontal lines from fractal points into the future, helping traders visualize potential price reactions at these levels until a candle closes above or below the line.
- Validation Candle Highlight: The “Show Validation Candle” option marks the candle that confirms a fractal, aiding traders in understanding when a fractal is fully formed and reliable.
- Compatibility: Designed for MT4 builds 600 and above, the indicator is accessible to most traders using the platform.
These features make the FRACTAL MTF Indicator suitable for both novice traders with a $200 account and experienced traders managing larger portfolios.
Currency Pairs and Timeframes
The FRACTAL MTF Indicator is optimized for major currency pairs: EUR/USD, GBP/USD, USD/JPY, AUD/USD, and USD/CAD. These pairs are highly liquid, offering tight spreads and consistent price action, which are ideal for fractal-based strategies. Here’s how the indicator performs across different timeframes:
- M1 (1-Minute): Ideal for scalpers, the M1 timeframe allows traders to use M5 or M15 fractals to identify short-term support and resistance. For example, on EUR/USD, M5 fractals can guide entries during volatile sessions like the London open.
- M5 (5-Minute): This timeframe suits day traders looking for quick trades. Using H1 fractals on the M5 chart for GBP/USD can help pinpoint entries during trend retracements.
- M15 (15-Minute): A balance between scalping and day trading, the M15 timeframe is excellent for USD/JPY traders using H4 fractals to trade breakouts or reversals.
- H1 (Hourly): Swing traders on AUD/USD can use H4 or D1 fractals to identify key levels for trend-following or counter-trend strategies.
- H4 (4-Hour): This timeframe is popular among swing traders analyzing USD/CAD. D1 fractals provide a robust framework for setting stop-losses and take-profits.
- D1 (Daily): Long-term traders use D1 fractals to identify major turning points. For EUR/USD, these levels often align with fundamental events like central bank announcements.
The flexibility to analyze fractals across these timeframes allows traders to adapt their strategies to their preferred trading style and market conditions.
Setting Up the FRACTAL MTF Indicator
Installing the FRACTAL MTF Indicator on MT4 is straightforward:
- Download the Indicator: Obtain the indicator files (e.g., Fractal-MTF.mq4 and Fractal-Utilities.mqh) from a trusted source like MQL5 or ForexMT4Indicators.com.
- Install the Files: Open MT4, go to File > Open Data Folder, and navigate to MQL4 > Indicators. Copy Fractal-MTF.mq4 and Fractal-Utilities.mqh into the appropriate folders (Indicators and Include, respectively).
- Compile the Indicator: Open MetaEditor, compile the .mq4 file to generate the .ex4 file, and restart MT4.
- Apply to Chart: Drag the indicator onto your desired chart, select the timeframe (e.g., H4 for H4 fractals), and adjust settings like the neighborhood radius or extend line function.
With a minimum deposit of $200, traders can start using the indicator on a micro account, where 0.01 lots are manageable for risk control.
Trading Strategies with the FRACTAL MTF Indicator
The FRACTAL MTF Indicator supports various trading strategies. Here are two practical approaches:
1. Breakout Strategy
- Setup: Apply H4 fractals to an M15 chart for EUR/USD.
- Entry: Wait for the price to break above an up-fractal (buy) or below a down-fractal (sell). Confirm the breakout with a strong candle close.
- Stop-Loss: Place the stop-loss below the fractal low (for buys) or above the fractal high (for sells).
- Take-Profit: Target the next significant fractal level or use a 1:2 risk-to-reward ratio.
- Example: On GBP/USD, an H4 up-fractal at 1.3000 breaks upward on the M15 chart. Enter a buy trade, set a stop-loss at 1.2970, and aim for 1.3060.
2. Reversal Strategy
- Setup: Use D1 fractals on an H1 chart for USD/JPY.
- Entry: Look for price rejection at a fractal level, confirmed by candlestick patterns like pin bars or engulfing candles.
- Stop-Loss: Set the stop-loss above the fractal high (for sells) or below the fractal low (for buys).
- Take-Profit: Target the next fractal level or a key support/resistance zone.
- Example: On AUD/USD, a D1 down-fractal at 0.6800 shows rejection on the H1 chart. Enter a sell trade, set a stop-loss at 0.6830, and target 0.6740.
These strategies leverage the indicator’s ability to highlight significant price levels, making it easier to align trades with market structure.
 Risk Management with a $200 Account
With a $200 minimum deposit, risk management is critical. Here are some tips:
- Position Sizing: Risk no more than 1-2% per trade. For a $200 account, this means $2-$4 per trade. Use micro lots (0.01) to keep risk low.
- Leverage: Opt for low leverage (e.g., 1:10 or 1:50) to avoid margin calls during volatile periods.
- Stop-Loss Placement: Use fractal levels to set logical stop-losses, ensuring they align with market structure.
- Diversification: Spread trades across currency pairs like USD/CAD and EUR/USD to reduce pair-specific risk.
By combining the FRACTAL MTF Indicator with disciplined risk management, traders can maximize their $200 account’s potential.
Advantages and Limitations
The FRACTAL MTF Indicator offers several advantages:
- Enhanced Market Insight: Viewing higher timeframe fractals on lower timeframes provides a comprehensive market perspective.
- Versatility: Suitable for scalping, day trading, and swing trading across multiple currency pairs.
- Ease of Use: The user-friendly interface and customizable settings cater to traders of all levels.
However, there are limitations:
- Performance Lag: The MTF version may be slower than single-timeframe fractal indicators due to additional computations.
- False Signals: Fractals can produce false breakouts or reversals in choppy markets, requiring confirmation from other indicators.
- Learning Curve: Novice traders may need time to master multi-timeframe analysis.
To mitigate these limitations, combine the indicator with tools like moving averages or RSI for confirmation and practice on a demo account before trading live.
Conclusion
The FRACTAL MTF Indicator V1.0 for MT4 is a robust tool for forex traders seeking to capitalize on fractal patterns across multiple timeframes. Its ability to display higher timeframe fractals on lower timeframe charts makes it ideal for trading major currency pairs like EUR/USD, GBP/USD, USD/JPY, AUD/USD, and USD/CAD. Whether you’re scalping on M1 or swing trading on H4, the indicator provides clear support and resistance levels to guide your trades. With a minimum deposit of $200, traders can use this tool to implement disciplined strategies, manage risk effectively, and unlock the potential of multi-timeframe analysis. Download the FRACTAL MTF Indicator today, test it on a demo account, and start enhancing your trading precision.
Join our Telegram for the latest updates and support
Comments (0)
No comments yet. Be the first to comment!
Leave a Comment