Introduction
The Schaff Trend Cycle (STC) Indicator V1.04 is a popular technical analysis tool designed to help traders identify market trends and potential reversals. Developed by Doug Schaff, this indicator combines the concepts of moving averages and the MACD (Moving Average Convergence Divergence) to generate more precise signals.
Unlike traditional oscillators that can produce false signals, the STC indicator smooths out price movements, making it a reliable tool for traders in forex, stocks, and cryptocurrencies. In this guide, we’ll explore how the Schaff Trend Cycle Indicator works, its key features, and how to use it effectively in your trading strategy.
What Is the Schaff Trend Cycle Indicator?
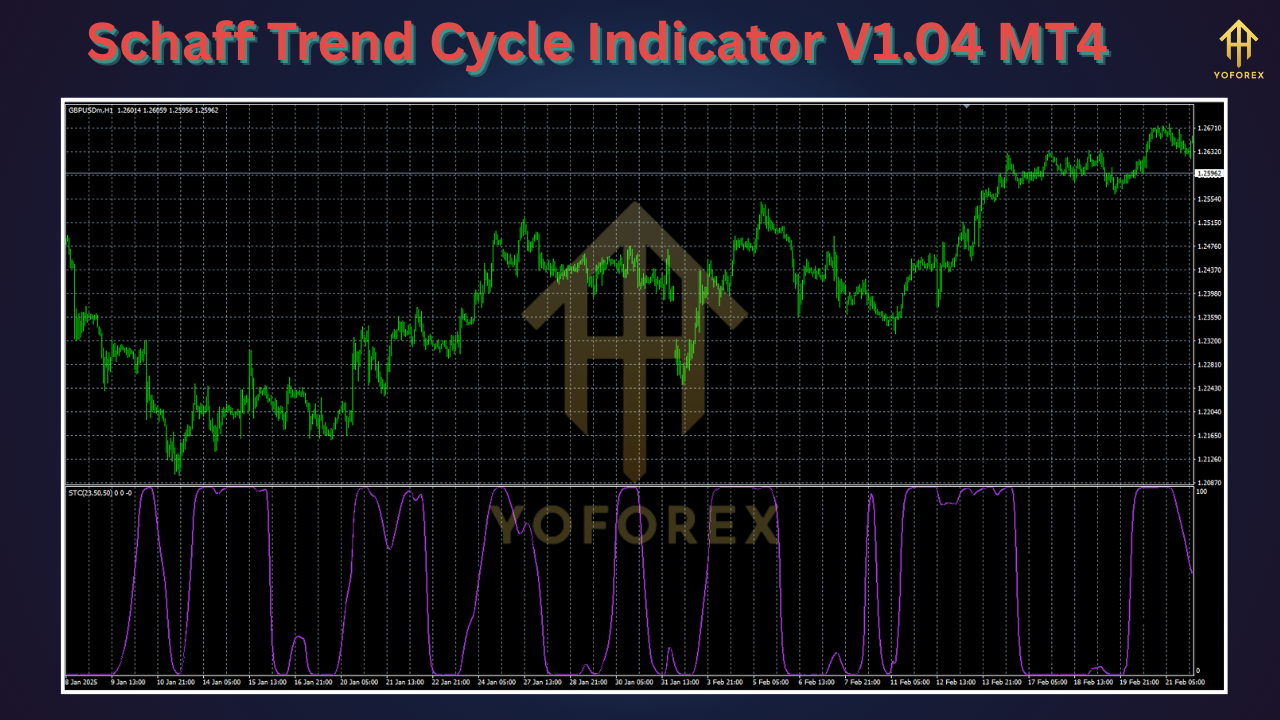
The Schaff Trend Cycle (STC) Indicator is a momentum-based oscillator that helps traders determine the strength and direction of a trend. It oscillates between 0 and 100, with key levels indicating overbought and oversold conditions:
- Above 75 → Overbought (Potential reversal or pullback)
- Below 25 → Oversold (Potential upward reversal)
The indicator uses an EMA (Exponential Moving Average) and a cycle calculation to filter out market noise, providing clearer trend signals.
Key Features of Schaff Trend Cycle V1.04
- Smoother Signals: Reduces false signals compared to traditional MACD or RSI.
- Customizable Parameters: Adjustable cycle length (default is 10) and fast/slow moving averages.
- Works Across Timeframes: Effective on intraday, swing, and long-term trading.
- Trend Confirmation: Helps confirm trend strength before entering a trade.
How Does the Schaff Trend Cycle Indicator Work?
The STC indicator calculates trends using the following steps:
- Computes a MACD-like value (difference between two EMAs).
- Applies a stochastic formula to smooth the data and generate oscillation.
- Plots a line between 0 and 100, with key levels at 25 and 75.
Interpreting the STC Indicator
- Rising STC Line (Above 25): Indicates a strengthening uptrend (Buy signal).
- Falling STC Line (Below 75): Suggests a weakening trend or reversal (Sell signal).
- Crossing Mid-Level (50): Confirms trend continuation.
How to Use the Schaff Trend Cycle Indicator in Trading
1. Trend Identification
- Uptrend Confirmation: When the STC line is above 50 and rising, the trend is bullish.
- Downtrend Confirmation: When the STC line is below 50 and falling, the trend is bearish.
2. Overbought/Oversold Signals
- Buy Signal: STC crosses above 25 from oversold territory.
- Sell Signal: STC crosses below 75 from overbought territory.
3. Combining with Other Indicators
For higher accuracy, traders often combine STC with:
- Moving Averages (MA) – Confirms trend direction.
- Support & Resistance Levels – Validates entry/exit points.
- Volume Indicators – Ensures strong momentum behind a trend.
Best Strategies for Trading with Schaff Trend Cycle V1.04
Strategy 1: Trend-Following Approach
- Entry: STC crosses above 25 + price above 200 MA.
- Exit: STC drops below 75 or trendline break.
Strategy 2: Reversal Trading
- Entry: STC exits overbought (75+) with a bearish candlestick pattern.
- Exit: STC reaches 25 or lower.
Strategy 3: Divergence Trading
- Bullish Divergence: Price makes lower lows, but STC makes higher lows → Potential reversal up.
- Bearish Divergence: Price makes higher highs, but STC makes lower highs → Potential reversal down.
Advantages of Schaff Trend Cycle Indicator
✅ Fewer False Signals – Smoothed calculations reduce whipsaws.
✅ Works in All Markets – Effective for forex, stocks, and crypto.
✅ Customizable Settings – Adjustable for different trading styles.
Limitations
❌ Lagging Indicator – Relies on past price data.
❌ Not Standalone – Best used with other confirmation tools.
How to Add Schaff Trend Cycle Indicator to Your Trading Platform
For MetaTrader 4/5:
- Download the STC indicator (.ex4 or .mq4 file).
- Open MT4/5 → File → Open Data Folder → MQL4 → Indicators.
- Paste the file and restart MT4/5.
- Drag & drop the indicator onto your chart.
For TradingView:
- Search for "Schaff Trend Cycle" in the Indicators panel.
- Apply it to your chart and adjust settings as needed.
Final Thoughts
The Schaff Trend Cycle Indicator V1.04 is a powerful tool for traders looking to improve trend analysis and reduce false signals. By combining it with moving averages, support/resistance, and volume indicators, traders can enhance their decision-making process.
Whether you're a day trader, swing trader, or long-term investor, the STC indicator can help you identify high-probability setups. Try it on your charts and see how it improves your trading accuracy!
FAQs
Q: Is the Schaff Trend Cycle better than MACD?
A: STC is smoother and generates fewer false signals, but MACD is better for momentum analysis. Combining both can improve accuracy.
Q: What’s the best timeframe for STC?
A: It works on all timeframes, but 1H, 4H, and daily charts are ideal for swing trading.
Q: Can STC predict exact reversals?
A: No, but it helps spot potential reversals when combined with price action.
Happy Trading!


Comments (0)
No comments yet. Be the first to comment!
Leave a Comment