Mastering the Markets: TMA Centered MACD OBV Indicator V2.0 for MT4
In the fast-paced world of forex and financial trading, having a reliable technical analysis tool can mean the difference between profit and loss. Among the myriad of indicators available, the TMA centered MACD OBV Indicator V2.0 stands out as a comprehensive solution for traders seeking to enhance their decision-making process. Combining three powerful metrics—Triangular Moving Average (TMA), Moving Average Convergence Divergence (MACD), and On-Balance Volume (OBV)—this indicator provides a holistic view of market trends, momentum, and volume dynamics. Whether you’re a novice trader looking to refine your strategy or a seasoned professional aiming to optimize performance, understanding how this tool works can elevate your trading game. In this guide, we’ll break down its components, functionality, and practical applications to help you leverage its full potential.
Understanding the Components
Before diving into the synergy of these indicators, let’s explore each component individually to grasp their significance:
1. Triangular Moving Average (TMA)
The Triangular Moving Average (TMA) is a weighted moving average designed to reduce lag and smooth price data. Unlike simple or exponential moving averages, TMA assigns greater weight to prices in the middle of the selected period, making it more responsive to recent price changes while filtering out noise. This characteristic makes TMA ideal for identifying trend direction and support/resistance levels. For example, a rising TMA suggests bullish momentum, while a falling TMA indicates bearish pressure.
2. Moving Average Convergence Divergence (MACD)
Developed by Gerald Appel, the MACD is a momentum oscillator that measures the relationship between two exponential moving averages (EMAs)—typically 12-day and 26-day EMAs. It consists of three key elements:
- MACD Line: The difference between the 12-day and 26-day EMAs.
- Signal Line: A 9-day EMA of the MACD line.
- Histogram: The visual representation of the gap between the MACD and signal lines.
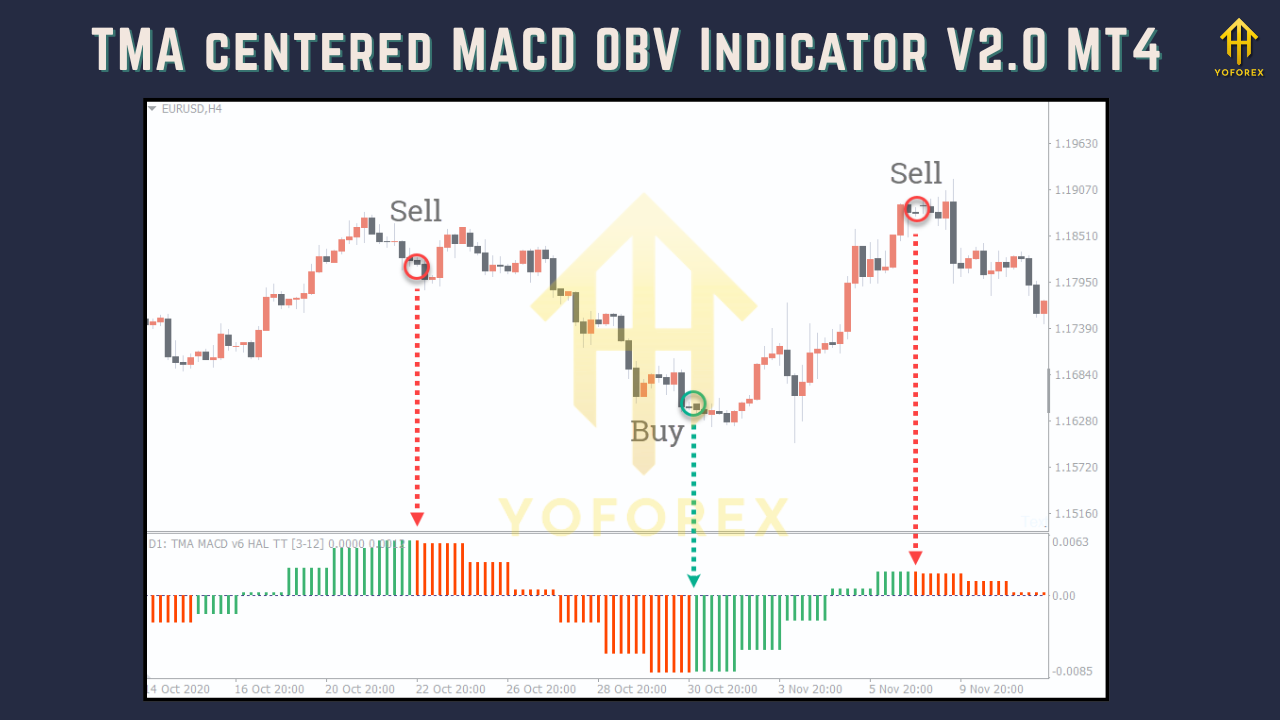
Traders use MACD to identify trend reversals, overbought/oversold conditions, and divergences between price and momentum. For instance, a bullish crossover (MACD crossing above the signal line) often signals a buying opportunity, while a bearish crossover suggests selling.
3. On-Balance Volume (OBV)
Created by Joseph Granville, OBV is a volume-based indicator that tracks cumulative buying and selling pressure. It works on the principle that volume precedes price movement: rising OBV indicates strong buying interest, while falling OBV suggests dominant selling pressure. By combining price action with volume, OBV helps confirm trend strength and detect potential reversals. For example, if prices are rising but OBV is declining, it may signal weakening buying momentum—a warning of a possible trend reversal.
Synergy of TMA, MACD, and OBV in V2.0
The true power of the TMA centered MACD OBV Indicator V2.0 lies in how these three indicators complement each other:
- TMA as the Trend Filter: The TMA acts as a dynamic trend identifier, providing a clear visual of the market’s direction. When combined with MACD, it helps filter out false signals by confirming whether the trend aligns with momentum. For instance, a bullish TMA (rising) paired with a bullish MACD crossover strengthens the case for long positions.
- MACD for Momentum Confirmation: While TMA identifies the trend, MACD adds depth by highlighting momentum shifts. A convergence between TMA and MACD (e.g., both signaling upward movement) reinforces trend strength, while divergence (e.g., TMA rising but MACD falling) warns of potential weakness.
- OBV for Volume Validation: OBV adds a critical layer of validation by ensuring that price movements are supported by volume. A bullish TMA and MACD signal gains credibility if OBV is rising, indicating strong buyer participation. Conversely, weak volume (falling OBV) despite positive TMA/MACD signals may suggest a lack of conviction, prompting caution.
This triad creates a robust framework for making informed trading decisions, reducing reliance on单一 indicators and minimizing false entries.
Key Features of V2.0
The latest iteration of the TMA centered MACD OBV Indicator introduces several enhancements to improve usability and accuracy:
- Customizable Parameters: Traders can adjust settings such as TMA period, MACD fast/slow periods, and OBV smoothing to align with their trading style (e.g., scalping vs. swing trading).
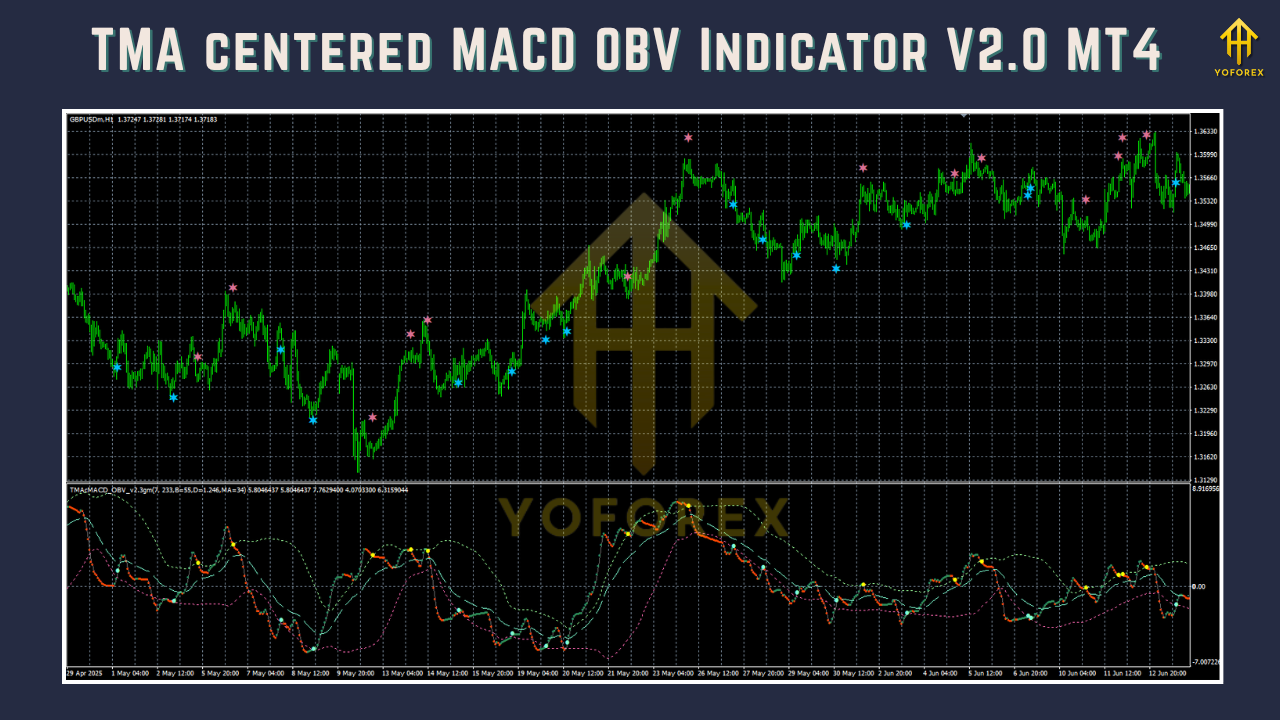
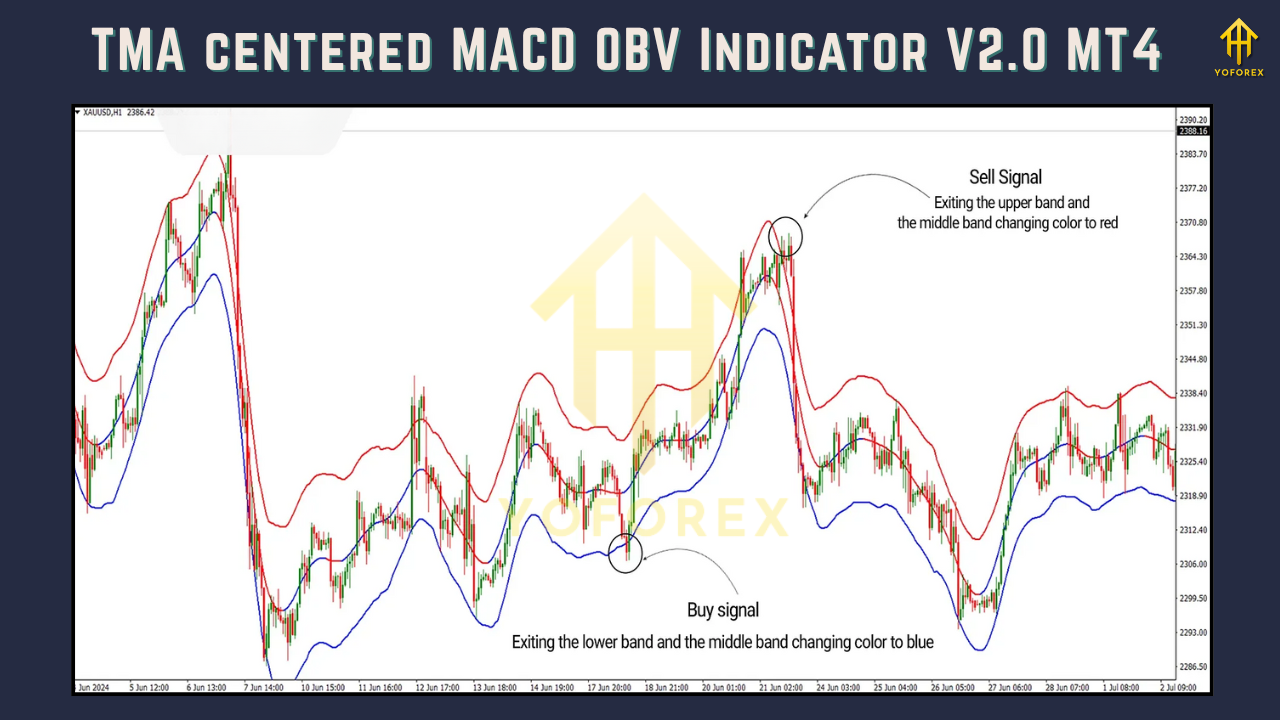
- Visual Clarity: Color-coded signals (e.g., green for buy, red for sell) and adjustable alert thresholds make it easy to spot opportunities at a glance.
- Multi-Timeframe Compatibility: The indicator supports multiple timeframes, allowing traders to analyze trends across daily, hourly, and minute charts for a comprehensive view.
- Backtesting Integration: Compatible with MT4’s Strategy Tester, enabling traders to validate performance before live deployment.
Practical Applications: Trading Strategies
To maximize the indicator’s potential, consider these proven strategies:
1. Trend Following with Confirmation
- Setup: Look for a bullish TMA (rising line) on the daily chart, followed by a bullish MACD crossover (MACD above signal line) on the 4-hour chart. Confirm with rising OBV.
- Entry: Buy when all three indicators align. Place stop-loss below the recent swing low; take profit at the next resistance level.
- Exit: Close positions if TMA turns bearish or MACD crosses below the signal line.
2. Divergence Trading
- Setup: Identify a bearish divergence where price makes a higher high but MACD forms a lower high. Ensure TMA remains bearish (falling line) and OBV confirms selling pressure (declining).
- Entry: Sell when MACD crosses below the signal line. Use TMA as a trailing stop to lock in profits.
- Risk Management: Limit position size to 1–2% of account balance to mitigate volatility.
3. Range Breakout Detection
- Setup: During consolidation phases, watch for TMA flattening (indicating range-bound conditions). If MACD breaks above/below zero and OBV surges, it signals a breakout.
- Entry: Enter long if MACD crosses above zero and OBV rises; short if MACD drops below zero and OBV falls.
- Confirmation: Wait for price to close beyond the range’s high/low to avoid假突破 (false breakouts).
Installation and Setup Guide for MT4
Follow these steps to integrate the indicator into your MT4 platform:
- Download the Indicator: Obtain the “TMA centered MACD OBV Indicator V2.0” file (usually a
.ex4or.mq4format) from a trusted source. - Upload to MT4:
- Open MT4 and navigate to
File > Open Data Folder. - Go to
MQL4 > Indicatorsand paste the downloaded file.
- Open MT4 and navigate to
- Apply to Chart:
- Restart MT4 and open a new chart (e.g., EUR/USD).
- Click
Insert > Indicators > Custom > TMA centered MACD OBV V2.0.
- Configure Settings:
- Adjust parameters like
TMAPeriod(default: 21),FastEMA(12),SlowEMA(26), andSignalSMA(9). - Enable alerts for buy/sell signals under the
Alertstab.
- Adjust parameters like
- Test and Optimize: Use the Strategy Tester to backtest settings against historical data. Fine-tune parameters based on your risk tolerance and trading goals.
Tips for Optimizing Performance
To get the most out of the TMA centered MACD OBV Indicator V2.0, keep these best practices in mind:
- Combine with Price Action: Use candlestick patterns (e.g., pin bars, engulfing patterns) to confirm signals. For example, a bullish MACD crossover paired with a morning star pattern increases confidence.
- Monitor Timeframes: Higher timeframes (daily/4-hour) provide stronger signals than lower ones (15-minute). Use shorter timeframes for entry timing and longer ones for trend direction.
- Manage Risk: Always use stop-loss orders and position sizing. Never risk more than 2% of your account per trade.
- Stay Updated: Markets evolve, so regularly review and adjust indicator settings to adapt to changing conditions.
Conclusion
The TMA centered MACD OBV Indicator V2.0 is a versatile tool that empowers traders to make data-driven decisions by merging trend, momentum, and volume analysis. Its customizable features and compatibility with MT4 make it accessible to traders of all experience levels. By understanding how each component interacts and applying structured strategies, you can harness its full potential to improve consistency and profitability.
Whether you’re day trading or holding positions overnight, this indicator provides the clarity needed to navigate volatile markets. Start experimenting with it today and take your trading to the next level!
Support & Disclaimer
Got questions or need help? Reach out anytime:
- WhatsApp: https://wa.me/+443300272265
- Telegram: https://t.me/yoforexrobot
Disclaimer: Past performance is no guarantee of future results. All trading carries risk. Always demo-test the TMA centered MACD OBV Indicator V2.0 MT4 in a risk-free environment before deploying on a live account.


Comments (0)
No comments yet. Be the first to comment!
Leave a Comment